


What Happened in the Oahu Real Estate Market in May 2025?
The Oahu real estate market remains steady, amidst continued but muted demand. Market activity has been somewhat dampened by higher mortgage interest rates and home prices, coupled with economic uncertainty. The single-family home market is stronger than the condo market, which has been softening since early 2024.
“A slower condo market this spring opens a window of opportunity for first-tf23vime homebuyers, small families, retirees and investors,” said Chief Sales Officer for Locations Chad Takesue. “For the first time in more than 25 years Oahu has more than seven months of condo supply, giving buyers the upper hand.”
Unlike the fast-paced real estate market of a few years ago, homebuyers—particularly those interested in purchasing a condo or townhome—have several advantages, including a greater selection of properties, more time to make a decision and increased negotiation power with sellers. “We’re seeing more price reductions and longer times on market as buyers weigh their options,” he added.
In the condo market, median prices are flat-to-decreasing. When comparing the past 12-month period to the year prior, condo prices have fallen the most in Salt Lake and Kaneohe, down eight percent and seven percent, respectively, while for-sale inventory more than doubled. In Makiki, the median condo price dropped five percent, as inventory grew by 35 percent. Median prices also came down three percent in Downtown-Nuuanu and Kapiolani-University, where 73 percent more units are for sale this year. Median prices are flat in West Oahu condo markets, where inventory has doubled. Within West Oahu, opportunity for buyers is greatest in Ewa, where inventory is up 125 percent and the median price dipped by one percent. Although inventory has doubled in Kailua and Hawaii Kai, median prices are up four percent and seven percent, respectively.
In the single-family home market, median prices are rising in every area except the North Shore and Waialae-Kahala, where prices can be affected by shifts in the variety of homes sold. For-sale inventory in all homes markets has increased moderately, with the exception of Manoa and Kaimuki, where inventory has dropped 42 percent and 26 percent, respectively. Median home prices have increased by eight percent and three percent in those markets.
Key Takeaways from the May 2025 Locations Oahu Real Estate Report
New to real estate market data terms? See our glossary.
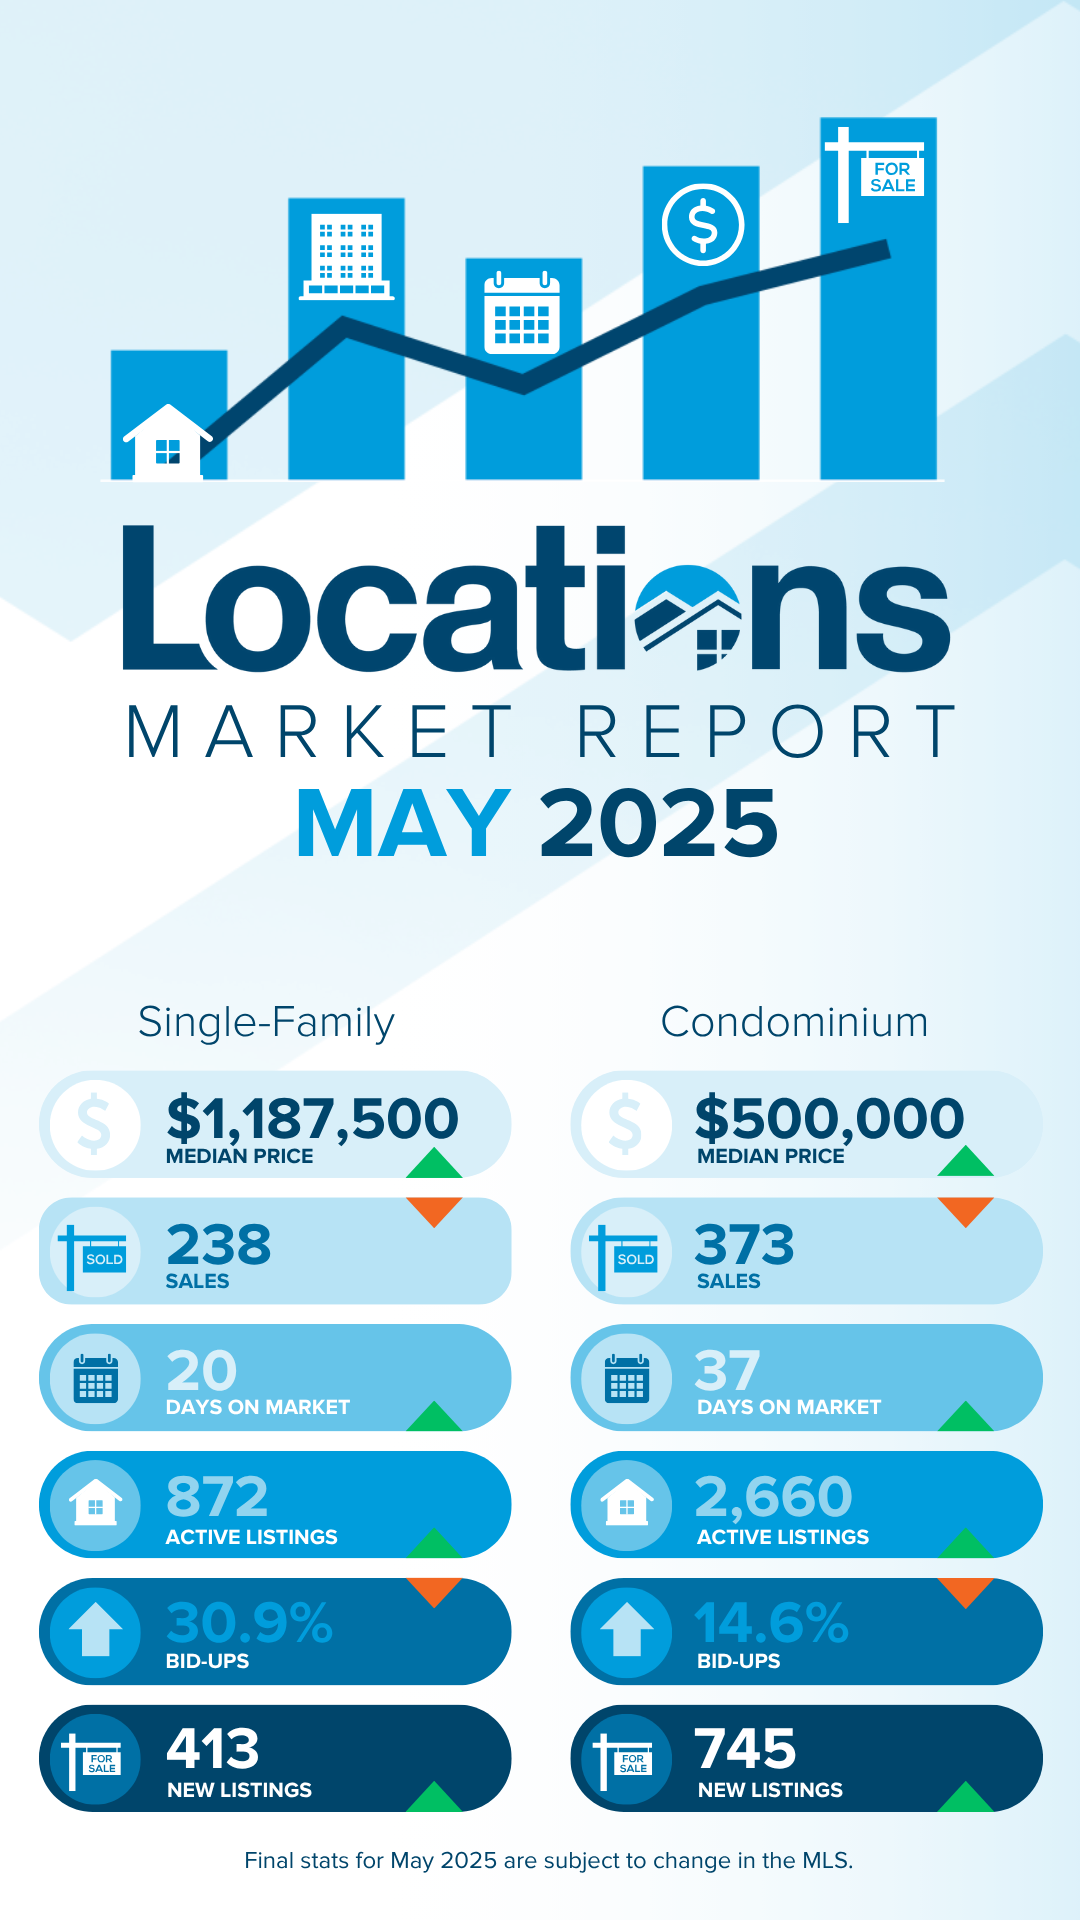
- The Oahu median single-family home price is flat-to-rising in 2025, while the median condo price is flat. In May 2025, the median single-family home price increased by 11 percent from a year ago to $1,187,500—the second highest on record—while the median condo price increased by two percent from last year to $500,000.
- Sales in May 2025 were muted again. Single-family home sales declined by six percent from a year ago, while condo sales fell by 23 percent. Sales are up from the beginning of the year, following seasonal patterns, with condo sales trending lower.
- Single-family home inventory remains low but is 30 percent higher than it was a year ago. Condo inventory is 56 percent higher than last year. There were 872 single-family homes and 2,660 condos available for sale at the end of May.
- At the end of May, the supply-demand measure of Months of Remaining Inventory (MRI) rose 26 percent for single-family homes and 65 percent for condos over last year. MRI is 3.8 months for homes and 7.3 months for condos, above the supply-demand balance point.
- Market times for both single-family homes and condos fell in May 2025, returning to the typical seasonal pattern after a bump in April 2025. Single-family homes were on the market for a median of 20 days in May, while condos were on the market for a median of 37 days.
- Competition is easing as inventory continues to grow. In May 2025, 30.9 percent of homes sold and 14.6 percent of condos sold were bid up over the asking price, about one in every three homes and one in every seven condos.
What Happened in Oahu Single-Family Home Markets in April 2025?
Market statistics can vary greatly by neighborhood, so it's important to consult a knowledgeable Realtor who has access to market-level data.
Here's a detailed breakdown of key Oahu single-family home market areas, looking at the past 12 months:
West Honolulu Homes
West Honolulu home sales rose by 18% to 142 homes. The median price increased slightly by 1% to $1,036,800. The median DOM held steady at 16 days. The bid-up percentage increased by 10% to 36.6%. MRI edged up by 4% to 3.2 months, while active listings grew by 23% to 38 homes.
Nuuanu-Makiki Homes
Nuuanu-Makiki home sales increased by 8% to 116 homes. The median price rose by 8% to $1,300,000. The median DOM declined by 9% to 21 days. The bid-up percentage increased by 9% to 27.6%. MRI rose slightly by 3% to 5.1 months, and active listings increased by 11% to 49 homes.
Manoa Homes
Manoa home sales jumped 15% to 71 homes. The median price climbed 8% to $1,700,000. The median DOM rose by 18% to 20 days. The bid-up percentage dropped sharply by 36% to 22.5%. MRI was cut in half, falling 50% to 2.5 months, while active listings dropped 42% to 15 homes.
Kaimuki Homes
Kaimuki home sales rose by 18% to 136 homes. The median price increased by 3% to $1,240,000. The median DOM rose 31% to 17 days. The bid-up percentage declined by 14% to 33.1%. MRI dropped 38% to 2.2 months, and active listings declined by 26% to 25 homes.
Waialae-Kahala Homes
Waialae-Kahala home sales increased 42% to 95 homes. The median price dipped slightly by 3% to $2,340,000. The median DOM dropped 46% to 13 days. The bid-up percentage rose 22% to 34.7%. MRI fell 22% to 2.8 months, while active listings rose 10% to 22 homes.
East Oahu Homes
East Oahu home sales were nearly flat, dipping 1% to 68 homes. The median price rose by 7% to $1,818,750. The median DOM increased 13% to 18 days. The bid-up percentage fell 31% to 30.9%. MRI increased by 19% to 3.5 months, and active listings rose 18% to 20 homes.
Hawaii Kai Homes
Hawaii Kai home sales increased 5% to 138 homes. The median price rose 5% to $1,650,000. The median DOM dropped by 11% to 16 days. The bid-up percentage was nearly flat, up 1% to 27.5%. MRI rose 29% to 3.4 months, while active listings climbed 34% to 39 homes.
Kailua Homes
Kailua home sales declined by 6% to 230 homes. The median price fell by 3% to $1,650,500. The median DOM rose by 8% to 14 days. The bid-up percentage decreased 19% to 29.1%. MRI rose 63% to 3.4 months, and active listings jumped 53% to 66 homes.
Kaneohe Homes
Kaneohe home sales rose 4% to 204 homes. The median price increased 8% to $1,300,000. The median DOM climbed 38% to 18 days. The bid-up percentage dropped by 20% to 29.4%. MRI increased 17% to 3.0 months, while active listings grew by 21% to 51 homes.
North Shore Homes
North Shore home sales climbed 31% to 76 homes. The median price fell by 11% to $1,505,000. The median DOM rose 49% to 34 days. The bid-up percentage inched up 6% to 23.7%. MRI declined 13% to 7.7 months, and active listings increased by 14% to 49 homes.
Leeward Homes
Leeward home sales fell 5% to 227 homes. The median price dropped by 1% to $670,000. The median DOM rose by 19% to 43 days. The bid-up percentage rose 13% to 23.8%. MRI increased 24% to 5.9 months, while active listings grew 18% to 112 homes.
Ewa Homes
Ewa home sales declined by 12% to 438 homes. The median price increased 4% to $912,500. The median DOM dropped 14% to 24 days. The bid-up percentage rose slightly by 5% to 31.3%. MRI jumped 84% to 4.3 months, and active listings grew 63% to 158 homes.
Makakilo Homes
Makakilo home sales grew 21% to 97 homes. The median price climbed 9% to $1,100,000. The median DOM remained unchanged at 23 days. The bid-up percentage increased 21% to 25.8%. MRI rose 20% to 3.6 months, and active listings rose 45% to 29 homes.
Waipahu Homes
Waipahu home sales increased 19% to 188 homes. The median price rose 3% to $960,000. The median DOM fell 45% to 15 days. The bid-up percentage increased 9% to 39.4%. MRI remained nearly flat, down 3% to 1.9 months, while active listings increased 16% to 29 homes.
Mililani Homes
Mililani home sales grew by 23% to 154 homes. The median price rose 2% to $1,092,500. The median DOM declined by 9% to 15 days. The bid-up percentage decreased by 4% to 34.4%. MRI climbed by 35% to 1.9 months, while active listings ticked up by 67% to 25 homes.
Pearl City-Aiea Homes
Pearl City-Aiea home sales dipped by 4% to 203 homes. The median price rose 6% to $1,089,000. The median DOM dropped by 19% to 13 days. The bid-up percentage declined by 16% to 33.5%. MRI increased by 81% to 2.4 months, and active listings jumped 74% to 40 homes.
What Happened in Oahu Condo Markets in May 2025?
Here's a detailed breakdown of key Oahu condo market areas, looking at the past 12 months:
Salt Lake Condos
Salt Lake condo sales declined by 17% to 134, while the median price fell by 8% to $405,500. The median Days on Market (DOM) remained steady at 33 days, and the bid-up percentage decreased by 31%. Months of Remaining Inventory (MRI) increased by 183% to 8.2 months, and active listings grew by 136% to 92 condos.
Downtown-Nuuanu Condos
Downtown-Nuuanu condo sales declined by 8% to 239, while the median price fell by 3% to $395,000. The median DOM rose by 6% to 36 days, and the bid-up percentage declined by 27%. MRI increased by 109% to 7.2 months, with active listings up by 92% to 144 condos.
Ala Moana-Kakaako Condos
Ala Moana-Kakaako condo sales declined slightly by 1% to 640, while the median price rose by 2% to $767,500. The median DOM rose by 6% to 57 days, and the bid-up percentage decreased by 47%. MRI rose by 34% to 9.8 months, with active listings up by 33% to 520 condos.
Makiki Condos
Makiki condo sales declined by 6% to 270, while the median price fell by 5% to $370,000. The median DOM rose by 2% to 43 days, and the bid-up percentage declined by 30%. MRI rose by 43% to 6.5 months, with active listings up by 34% to 146 condos.
Waikiki Condos
Waikiki condo sales declined by 17% to 918, while the median price fell by 6% to $460,000. The median DOM rose by 3% to 37 days, and the bid-up percentage decreased by 25%. MRI increased by 60% to 8.6 months, with active listings up by 33% to 655 condos.
Kapiolani-University Condos
Kapiolani-University condo sales declined by 13% to 212, while the median price fell by 3% to $401,500. The median DOM rose by 7% to 29 days, and the bid-up percentage declined by 30%. MRI rose by 78% to 7.6 months, with active listings up by 54% to 134 condos.
Diamond Head-Kahala Condos
Diamond Head-Kahala condo sales rose by 22% to 116, while the median price rose by 3% to $676,500. The median DOM remained steady at 25 days, and the bid-up percentage fell by 55%. MRI decreased slightly by 2% to 6.2 months, with active listings up by 20% to 60 condos.
Hawaii Kai Condos
Hawaii Kai condo sales rose by 8% to 138, while the median price increased by 7% to $855,500. The median DOM rose by 39% to 25 days, and the bid-up percentage fell by 43%. MRI rose sharply by 521% to 7.6 months, with active listings up by 569% to 87 condos.
Kailua Condos
Kailua condo sales rose by 8% to 94, while the median price rose by 4% to $815,000. The median DOM remained steady at 19 days, and the bid-up percentage increased slightly by 2%. MRI rose by 104% to 4.2 months, with active listings up by 120% to 33 condos.
Kaneohe Condos
Kaneohe condo sales rose by 14% to 164, while the median price fell by 7% to $655,500. The median DOM remained steady at 16 days, and the bid-up percentage decreased by 16%. MRI rose by 92% to 5.3 months, with active listings up by 118% to 72 condos.
Leeward Condos
Leeward condo sales declined by 10% to 133, while the median price fell by 6% to $230,000. The median DOM rose by 16% to 44 days, and the bid-up percentage decreased by 29%. MRI increased by 50% to 9.6 months, with active listings up by 36% to 106 condos.
Ewa Condos
Ewa condo sales declined by 2% to 346, while the median price remained steady at $675,000. The median DOM remained steady at 30 days, and the bid-up percentage was unchanged. MRI rose by 129% to 7.1 months, with active listings up by 125% to 205 condos.
Makakilo Condos
Makakilo condo sales declined by 4% to 94, while the median price was unchanged at $551,000. The median DOM rose by 27% to 26 days, and the bid-up percentage declined by 24%. MRI rose by 103% to 5.0 months, with active listings up by 95% to 39 condos.
Waipahu Condos
Waipahu condo sales rose by 1% to 150, while the median price fell by 1% to $495,500. The median DOM rose by 9% to 24 days, and the bid-up percentage declined by 13%. MRI rose by 94% to 4.9 months, with active listings up by 97% to 61 condos.
Mililani Condos
Mililani condo sales declined by 4% to 270, while the median price fell by 1% to $512,500. The median DOM rose by 4% to 27 days, and the bid-up percentage declined by 21%. MRI rose by 90% to 4.5 months, with active listings up by 84% to 101 condos.
Pearl City-Aiea Condos
Pearl City-Aiea condo sales rose by 3% to 266, while the median price remained steady at $468,500. The median DOM rose by 1% to 27 days, and the bid-up percentage declined by 36%. MRI rose by 95% to 5.9 months, with active listings up by 100% to 130 condos.
Summary
Because real estate market conditions can vary greatly among Oahu market areas, it's important for buyers and sellers to partner with a Realtor who has access to detailed, neighborhood-level data.
Glossary
- Active Listings: Count of MLS listings with "Active" status on the last day of the period.
- Bid-Up %: The percent of sales that were bid-up over asking price in competitive offers.
- Days on Market (DOM): Median number of days between listing date and escrow date, for all properties sold in the period.
- Months of Remaining Inventory (MRI): The number of months it would take to sell out the current active inventory at the recent rate of sales. A balance point between supply and demand is considered to be around 6 months, so MRI below 6 months indicates more of a sellers market and MRI above 6 months indicates more of a buyers market.


