


What Happened in the Oahu Real Estate Market in February 2025?
“The Oahu real estate market showed more signs of diverging home and condo markets in February,” said Chief Sales Officer for Locations Chad Takesue. “The single-family home market remains steady and strong, with rising prices and several indicators of competitive demand. The condo resale market, on the other hand, continues to show more signs of softening.”
Takesue noted that while available inventory for single-family homes is low and flat, the supply of condos for sale is at a 15-year high and rising. With condo sales falling short, Months of Remaining Inventory now stands at 6.0 months--the tipping point from a sellers' market to a buyers' market. “The condo market continues to be affected by recent challenges to insurance and maintenance costs,” he added. “Condos are staying on the market longer, and competition has eased. As a result, condo supply has increased significantly from a year ago and prices have flattened. Many local condo resale markets now favor buyers.”
Available inventory for re-sale condos is higher in town, where more concrete towers and aging housing stock can be found. Supply is greatest in the Ala Moana-Kakaako market at 8.9 months (due to continued new condo development in the area) and Leeward Oahu at 8.6 months. The tightest supply-demand condo markets are Kailua at 3.1 months, Mililani at 3.3 months and Kaneohe at 3.5 months. West Oahu condo markets typically have lower inventory levels compared to in-town markets.
Single-family home inventory is also typically lower in the West Oahu markets.The tightest supply-demand market is Pearl City-Aiea at just 1.5 months, indicating very strong demand. Other tight single-family home markets include Waipahu, Mililani, Kaneohe, Kailua and Waialae-Kahala, all with about 2 months of remaining inventory. Demand is relatively softer in Oahu’s most rural markets. The highest remaining supply markets for homes are North Shore at 7.5 months and Leeward at 5.7 months.
The mortgage rate environment is improving. After starting the year above 7%, the 30-year fixed mortgage rate has declined steadily and is now a quarter-point lower at 6.76%. Rates are expected to continue to fall to around 6.5%. However, increased sales activity due to greater affordability may be offset by reduced consumer confidence in the current economic and political environment.
Key Takeaways from the February 2025 Locations Oahu Real Estate Report
New to real estate market data terms? See our glossary.
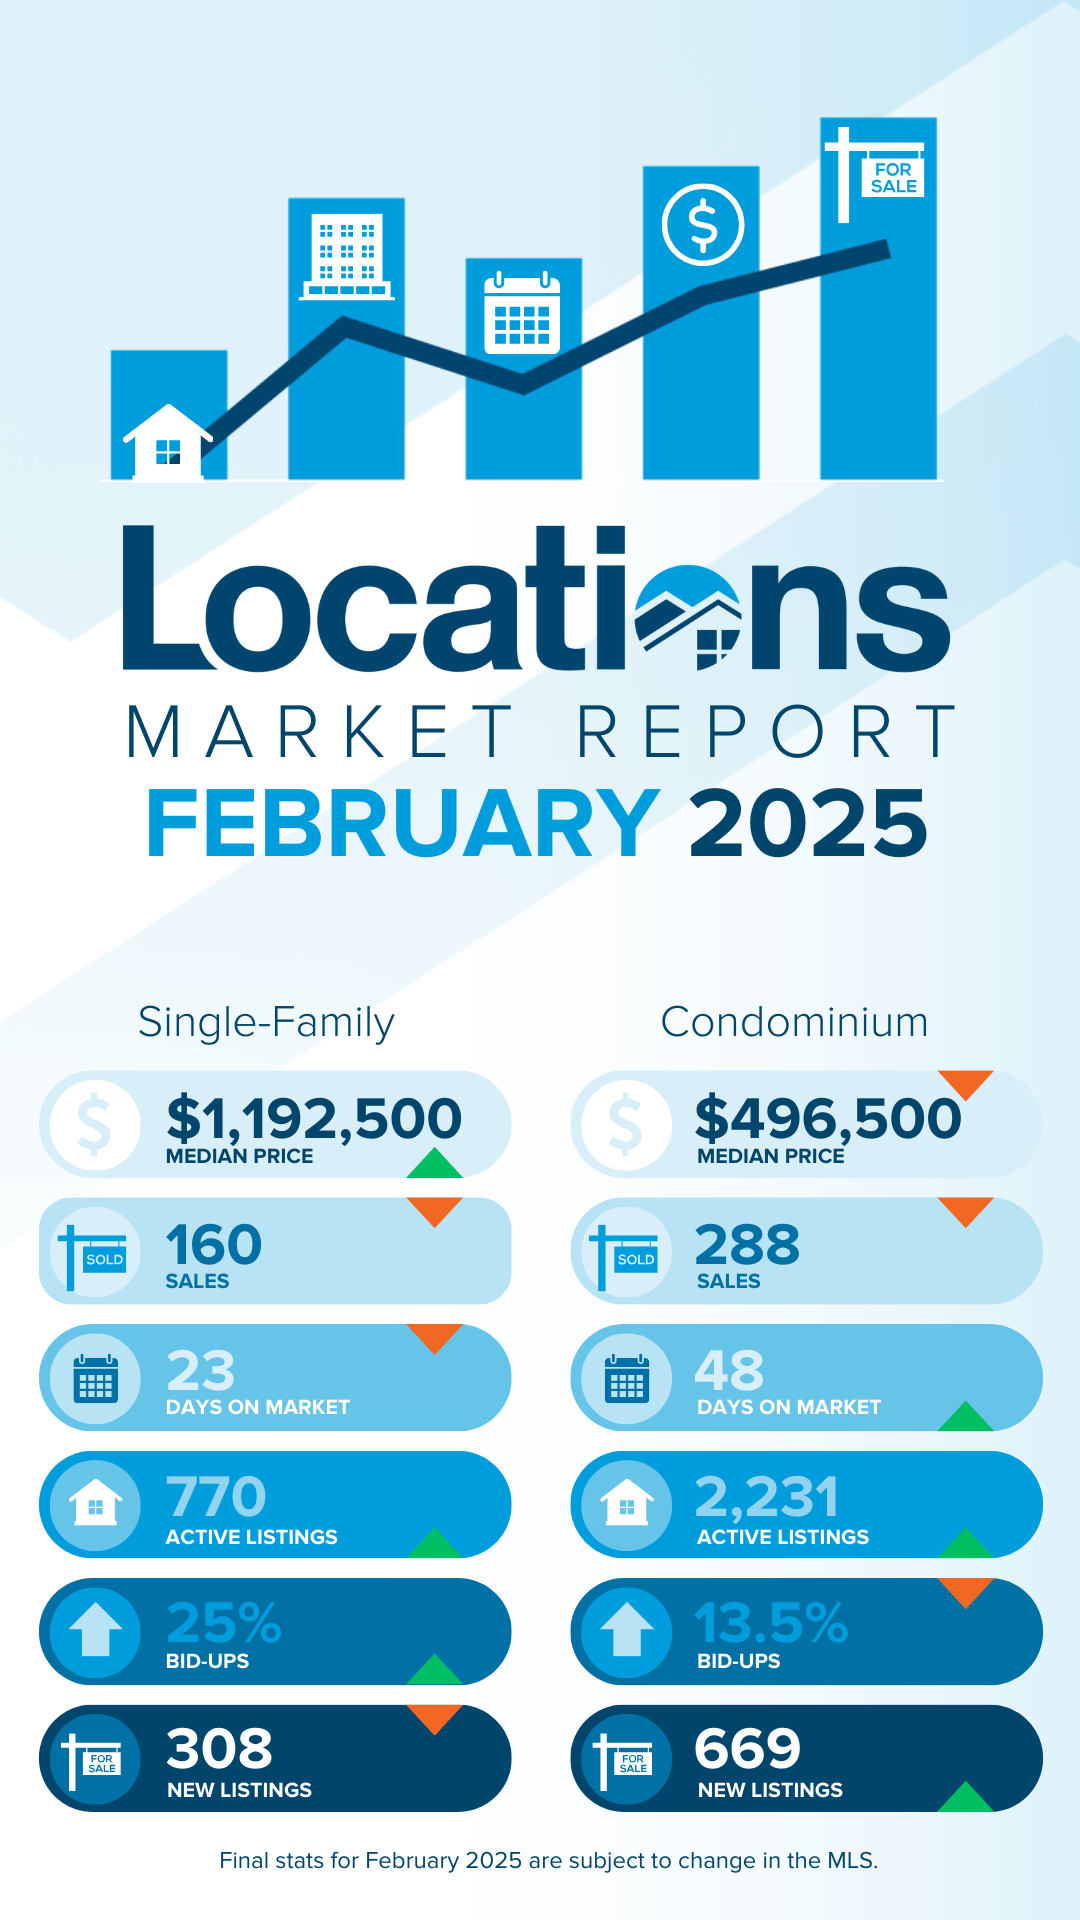
- Oahu median housing price activity was mixed in February 2025. The median single-family home price increased by 11 perecent from a year ago to $1,192,500—a record high. The median condo price fell by three percent to $496,500.
- Sales were down from last February, with a decrease of 13 percent for single-family homes and 15 percent for condos. February closed sales numbers are typically the lowest of the year.
- Single-family home inventory is flat and low, with 770 homes for sale at the end of February. Condo inventory increased by 54 percent from a year ago to 2,231 condos.
- At the end of February, the supply-demand measure of Months of Remaining Inventory (MRI) was flat for single-family homes at 3.3 months and up for condos at 6.0 months--the balance point. MRI for condos increased by 61 percent from a year ago.
- Single-family homes were on the market for a median of 23 days last month, against the typical upward seasonal trend. Condos were on the market for a median of 48 days, a 12-year high.
- In February 2025, one in four single-family homes and about one in seven condos sold were bid up over the asking price. Competition in the condo market is easing.
What Happened in Oahu Single-Family Home Markets in February 2025?
Market statistics can vary greatly by neighborhood, so it's important to consult a knowledgeable Realtor who has access to market-level data.
Here's a detailed breakdown of key Oahu single-family home market areas, looking at the past 12 months:
West Honolulu Homes
West Honolulu home sales rose by 15% to 138 homes. The median price increased by 2% to $1,023,500. The average DOM increased by 19% to 19 days. The bid-up percentage grew by 18% to 36.2%. MRI declined by 17% to 3.4 months, and active listings fell by 5% to 39 homes.
Nuuanu-Makiki Homes
Nuuanu-Makiki home sales increased by 16% to 116 homes. The median price rose by 13% to $1,300,000. The average DOM increased by 8% to 20 days. The bid-up percentage improved by 13% to 29.3%. MRI decreased by 3% to 4.6 months, while active listings grew by 13% to 44 homes.
Manoa Homes
Manoa home sales increased by 6% to 71 homes. The median price rose by 11% to $1,675,000. The average DOM increased by 53% to 23 days. The bid-up percentage declined by 46% to 21.1%. MRI decreased by 11% to 3.0 months, and active listings declined by 5% to 18 homes.
Kaimuki Homes
Kaimuki home sales grew by 15% to 132 homes. The median price increased by 5% to $1,265,000. The average DOM rose by 21% to 17 days. The bid-up percentage dropped by 17% to 31.8%. MRI fell by 24% to 2.5 months, while active listings declined by 13% to 28 homes.
Waialae-Kahala Homes
Waialae-Kahala home sales increased by 42% to 92 homes. The median price remained stable at $2,362,500. The average DOM decreased by 53% to 14 days. The bid-up percentage rose by 55% to 35.9%. MRI decreased by 52% to 2.0 months, while active listings declined by 32% to 15 homes.
East Oahu Homes
East Oahu home sales increased by 3% to 67 homes. The median price rose by 20% to $1,950,000. The average DOM remained unchanged at 17 days. The bid-up percentage declined by 36% to 28.4%. MRI increased by 49% to 4.1 months, while active listings rose by 53% to 23 homes.
Hawaii Kai Homes
Hawaii Kai home sales remained relatively stable, decreasing slightly by 1% to 132 homes. The median price increased by 9% to $1,675,000. The average DOM declined by 8% to 17 days. The bid-up percentage rose by 12% to 30.3%. MRI increased by 19% to 2.9 months, while active listings also increased by 19% to 32 homes.
Kailua Homes
Kailua home sales declined by 7% to 227 homes. The median price remained steady at $1,651,000. The average DOM decreased by 7% to 14 days. The bid-up percentage remained nearly unchanged, falling slightly by 2% to 31.7%. MRI increased by 19% to 2.2 months, while active listings rose by 11% to 41 homes.
Kaneohe Homes
Kaneohe home sales rose by 16% to 214 homes. The median price increased by 5% to $1,250,000. The average DOM increased by 14% to 16 days. The bid-up percentage declined by 14% to 29.9%. MRI grew by 7% to 2.0 months, while active listings increased by 24% to 36 homes.
North Shore Homes
North Shore home sales increased by 20% to 66 homes. The median price declined by 1% to $1,593,000. The average DOM increased by 50% to 38 days. The bid-up percentage dropped by 5% to 24.2%. MRI decreased by 5% to 7.5 months, while active listings rose by 14% to 41 homes.
Leeward Homes
Leeward home sales declined by 3% to 235 homes. The median price fell by 2% to $670,000. The average DOM remained steady at 38 days. The bid-up percentage increased slightly by 1% to 23.4%. MRI increased by 27% to 5.7 months, while active listings rose by 23% to 111 homes.
Ewa Homes
Ewa home sales increased by 7% to 505 homes. The median price rose by 2% to $900,000. The average DOM decreased by 27% to 22 days. The bid-up percentage declined slightly by 3% to 29.9%. MRI grew by 27% to 3.6 months, while active listings increased by 35% to 150 homes.
Makakilo Homes
Makakilo home sales increased by 12% to 95 homes. The median price remained steady at $1,050,000. The average DOM increased slightly by 4% to 26 days. The bid-up percentage declined by 11% to 23.2%. MRI increased by 11% to 3.9 months, while active listings rose by 24% to 31 homes.
Waipahu Homes
Waipahu home sales increased by 13% to 186 homes. The median price rose by 5% to $965,000. The average DOM declined by 44% to 15 days. The bid-up percentage increased by 30% to 40.3%. MRI grew by 12% to 1.9 months, while active listings increased by 26% to 29 homes.
Mililani Homes
Mililani home sales remained relatively stable, increasing by 1% to 144 homes. The median price rose by 1% to $1,071,250. The average DOM decreased by 9% to 16 days. The bid-up percentage increased by 6% to 34.7%. MRI nearly doubled, rising by 99% to 2.0 months, while active listings increased by 100% to 24 homes.
Pearl City-Aiea Homes
Pearl City-Aiea home sales rose by 22% to 229 homes. The median price increased by 11% to $1,098,000. The average DOM decreased by 32% to 13 days. The bid-up percentage declined slightly by 4% to 36.2%. MRI decreased by 31% to 1.4 months, while active listings fell by 16% to 27 homes.
What Happened in Oahu Condo Markets in February 2025?
Here's a detailed breakdown of key Oahu condo market areas, looking at the past 12 months:
Salt Lake Condos
Salt Lake condo sales decreased by 7% to 149, while the median price fell by 3% to $425,000. Days on Market (DOM) rose by 71% to 29 days, and the bid-up percentage decreased by 4%. Months of Remaining Inventory (MRI) rose by 229% to 5.4 months, and active listings grew by 205% to 67 condos.
Downtown-Nuuanu Condos
Downtown-Nuuanu condo sales decreased by 3% to 249, while the median price fell by 3% to $395,000. DOM increased by 33% to 32 days, and the bid-up percentage fell by 24%. MRI rose by 105% to 5.3 months, with active listings up by 98% to 111 condos.
Ala Moana-Kakaako Condos
Ala Moana-Kakaako condo sales declined by 3% to 637, while the median price rose by 4% to $780,000. DOM increased by 63% to 52 days, and the bid-up percentage dropped by 42%. MRI rose by 37% to 8.9 months, with active listings up by 34% to 475 condos.
Makiki Condos
Makiki condo sales decreased by 5% to 274, while the median price fell by 5% to $380,000. DOM rose by 83% to 39 days, and the bid-up percentage decreased by 33%. MRI rose by 19% to 5.1 months, with active listings increasing by 14% to 116 condos.
Waikiki Condos
Waikiki condo sales decreased by 9% to 980, while the median price increased by 3% to $450,000. DOM rose by 21% to 34 days, and the bid-up percentage fell by 27%. MRI increased by 43% to 6.9 months, with active listings up by 30% to 564 condos.
Kapiolani-University Condos
Kapiolani-University condo sales decreased by 4% to 226, while the median price decreased by 1% to $411,000. DOM increased by 59% to 27 days, and the bid-up percentage dropped by 20%. MRI rose by 33% to 5.8 months, with active listings up by 28% to 109 condos.
Diamond Head-Kahala Condos
Diamond Head-Kahala condo sales increased by 21% to 111, while the median price decreased by 3% to $655,000. DOM increased by 62% to 21 days, and the bid-up percentage fell by 37%. MRI rose by 37% to 6.6 months, with active listings increasing by 65% to 61 condos.
Hawaii Kai Condos
Hawaii Kai condo sales decreased by 4% to 139, while the median price fell by 2% to $825,000. DOM increased by 14% to 18 days, and the bid-up percentage decreased by 11%. MRI rose by 262% to 5.7 months, with active listings up by 247% to 66 condos.
Kailua Condos
Kailua condo sales decreased by 2% to 93, while the median price rose by 9% to $835,000. DOM increased by 27% to 19 days, and the bid-up percentage fell by 35%. MRI increased by 89% to 3.1 months, with active listings up by 85% to 24 condos.
Kaneohe Condos
Kaneohe condo sales increased by 30% to 173, while the median price fell by 2% to $679,000. DOM remained stable at 15 days, and the bid-up percentage fell by 15%. MRI rose by 70% to 3.5 months, with active listings up by 122% to 51 condos.
Leeward Condos
Leeward condo sales decreased by 1% to 147, while the median price fell by 8% to $239,000. DOM increased by 55% to 45 days, and the bid-up percentage dropped by 58%. MRI rose by 64% to 8.6 months, with active listings up by 62% to 105 condos.
Ewa Condos
Ewa condo sales decreased by 9% to 343, while the median price remained unchanged at $680,000. DOM increased by 81% to 29 days, and the bid-up percentage fell by 8%. MRI rose by 136% to 5.4 months, with active listings up by 114% to 154 condos.
Makakilo Condos
Makakilo condo sales fdeclined by 19% to 90, while the median price increased by 2% to $560,000. DOM rose by 33% to 28 days, and the bid-up percentage decreased by 31%. MRI rose by 154% to 4.4 months, with active listings up by 106% to 33 condos.
Waipahu Condos
Waipahu condo sales decreased by 6% to 145, while the median price remained unchanged at $499,000. DOM increased by 23% to 15 days, and the bid-up percentage fell by 19%. MRI rose by 298% to 3.7 months, with active listings up by 275% to 45 condos.
Mililani Condos
Mililani condo sales increased by 3% to 295, while the median price remained unchanged at $515,000. DOM increased by 60% to 24 days, and the bid-up percentage fell by 26%. MRI rose by 71% to 3.3 months, with active listings up by 76% to 81 condos.
Pearl City-Aiea Condos
Pearl City-Aiea condo sales increased by 9% to 268, while the median price increased by 5% to $484,000. DOM increased by 44% to 25 days, and the bid-up percentage fell by 33%. MRI rose by 98% to 4.7 months, with active listings up by 116% to 106 condos.
Summary
Because real estate market conditions can vary greatly among Oahu market areas, it's important for buyers and sellers to partner with a Realtor who has access to detailed, neighborhood-level data.
Glossary
- Active Listings: Count of MLS listings with "Active" status on the last day of the period.
- Bid-Up %: The percent of sales that were bid-up over asking price in competitive offers.
- Days on Market (DOM): Median number of days between listing date and escrow date, for all properties sold in the period.
- Months of Remaining Inventory (MRI): The number of months it would take to sell out the current active inventory at the recent rate of sales. A balance point between supply and demand is considered to be around 6 months, so MRI below 6 months indicates more of a sellers market and MRI above 6 months indicates more of a buyers market.


